
Agile Series Episode 3: AI-Augmented Agile Metrics and Reporting
By: Hajime Estanislao, PMP®; Editor: Geram Lompon; Reviewed by: Alvin Villanueva, PMP®
Traditional metrics, such as burndown charts, velocity, and cycle time, provide valuable insights but may fall short when anticipating change. As Agile environments expand across teams and geographies, the need for more adaptive, forward-looking intelligence becomes clear. Agile teams require reports and context-aware analysis to identify early signs of risk, shifting workloads, or changing team behavior.
AI augmentation introduces a new dimension to Agile reporting. By embedding analytics, natural language processing, and trend analysis methods, teams can transition from static tracking to dynamic forecasting.
The trend analysis definition refers to examining historical data to identify patterns, uptrends, or stagnation, which is relevant for financial forecasting in projects and data-driven decision-making. These AI-enhanced tools detect recurring patterns, integrate external factors such as market trends, and interpret large volumes of historical data. Sufficient data is essential to ensure accurate trend analysis and generate reliable AI-driven insights, as insufficient data can lead to misleading or flawed predictions.
In this episode, we explore how combining traditional metrics with AI capabilities transforms Agile reporting into a system of insight. You will learn more about AI-augmented Agile metrics, why they matter, and how to adopt them through structured steps. Ready to move beyond tracking and start understanding what is likely to come? This guide is for you.

What Are AI-Augmented Agile Metrics and Reporting?
A Closer Look at Agile Metrics and Reporting
At its core, Agile reporting is about clarity, helping teams understand their current status and what is getting in the way. It captures information on work completed, remaining work, the team’s workload, and team throughput, enabling decision-making processes during and after each sprint.
Tools like burndown charts, which visualize the work remaining over time and are essential in Agile and Scrum methodologies, help teams track progress, predict completion, and distinguish between different types of charts. A sprint burndown chart is a visual tool used during agile sprints to track remaining work, predict the likelihood of completing the sprint, and monitor team velocity.
Tools such as cumulative flow diagrams, velocity trends, and performance dashboards visually represent the health of delivery and productivity. Tracking progress with these charts is crucial for effective
Yet, traditional reporting practices are grounded in past data and often require manual analysis to identify significant shifts. It makes it harder to spot early warning signs or adapt to rapid market dynamics.

Where AI Makes a Difference in Predicting Future Outcomes
AI-augmented Agile metrics enhance these practices by turning static metrics into real-time indicators. AI doesn’t just summarize but also analyzes, interprets, and predicts. Using machine learning and statistical models, AI can detect fluctuations in story points, project risks, or performance anomalies well before they show up in retrospectives. NLP capabilities can even assess sentiment and risk patterns from team discussions.
Most importantly, AI tools integrate multiple data sources from sprint logs to financial statements and market research, which plays a role in gathering reliable industry and consumer data for trend analysis. To inform investment decisions, these tools also analyze sales regions and their importance in evaluating revenue and cost risks, especially when market trends are horizontal or stagnant. AI tools generate dynamic, context-aware reports that support decision-making across functions. Data analysis informs strategic decision-making and helps organizations adapt to changing market conditions effectively. The result is a comprehensive view of Agile performance, reflecting both internal progress and external realities.

Why This Matters Now
When volatile markets and distributed teams shape future outcomes, leveraging AI strengthens Agile reporting. Many teams still rely on outdated views that fail to reflect complexity, leading to missed signals and delayed interventions. AI brings the foresight needed to operate with greater agility, insight, and alignment. AI-augmented Agile reporting enables teams to predict future outcomes and proactively plan for upcoming developments.
- Uses trend analysis to anticipate delays, delivery bottlenecks, or rising technical debt by identifying patterns in data to inform decision-making
- Supports data-driven decision-making across sprint planning, resourcing, and scope review
- Automates routine reporting, reducing manual work across many Agile teams
- Integrates external factors like market shifts, competitor activity, or customer behavior
- Enables early detection of scope creep, resource imbalance, or delivery risks
- Provides visibility into future trends, forecasting future events, and future movements to improve risk management and adaptability
- Helps teams compare data points over time to identify trends and inform strategy
- Aligns team delivery with broader business strategy and economic conditions
- Produces AI-generated summaries that are accessible to both technical and non-technical stakeholders
- Detects trend lines and anomalies from continuous feedback and evolving datasets
- Shifts Agile reporting from static measurement to meaningful, outcome-oriented insights.

Predictive Analytics in Agile
Predictive analytics transforms Agile
Key performance indicators like story points, velocity, and burndown charts are no longer just retrospective tools as they become the foundation for predictive models that help track progress and inform proactive measures. By leveraging predictive analytics, Agile teams can identify emerging trends, adjust real-time plans, and ensure efficient resource allocation. It improves

Step-by-Step Instructions for Integrating AI
Integrating AI into your Agile process is not about discarding what works but reinforcing it with scalable, context-sensitive capabilities. This sequence focuses on practical integration while preparing teams for long-term analytical maturity.
3.2 Audit the Inputs
Evaluate the health, completeness, and relevance of your data sources through audits. Ensure you have sufficient data for accurate trend analysis and reliable AI predictions. Incomplete or low-quality data can undermine the effectiveness of AI-driven insights.
3.7 Learn and Adjust
Review predictions versus actual outcomes. Compare data from your AI model’s forecasts with real-world results to identify gaps and refine your models. This ongoing process helps improve the relevance and accuracy of your AI-driven recommendations.

Clarify the Why – Define the Purpose
Identify your reporting challenges. Are you struggling with forecast reliability, risk visibility, or workload balance? Pinpointing the goal sets the foundation for choosing the right AI approach.
Audit the Inputs – Evaluate Data Health
Ensure your historical data, including sprint metrics, user stories, and delivery timelines, is accurate and well-structured. Quality AI models need quality inputs to produce meaningful forecasts.
Choose the Right Lens – Select Appropriate Tools
Explore platforms that support predictive analytics, NLP-based insights, or real-time dashboards. Tools should align with your existing stack (e.g., Jira, Azure DevOps) and scale with team needs.
Connect the Dots – Integrate Diverse Data Sources
Bring in structured and unstructured data such as financial indicators, customer feedback, and backlog movement to give AI a view of delivery drivers and constraints.
Start with Signals – Focus on Early Trend Detection
Begin by letting AI highlight shifts in work completed, velocity, or team sentiment. Use this insight to support retrospectives or validate sprint goals.
Share the Story – Automate Reports and Insights
Generate AI-curated reports that emphasize trends, risks, and projections. Make them stakeholder-friendly to support cross-functional alignment and transparency.
Learn and Adjust – Refine Through Feedback
AI tools improve over time. Review predictions, compare them with actual outcomes, and fine-tune inputs to increase relevance and reliability.

Agile Team Performance
Optimizing Agile team performance is essential for delivering successful projects, and predictive analytics is pivotal in this process. By examining data points such as sprint velocity, story points, and burndown charts, teams can uncover trends and patterns that directly impact their effectiveness. This data-driven approach enables Agile teams to track progress accurately, forecast future performance, and deploy improvements.
With predictive analytics, teams can proactively allocate resources, prioritize tasks, and address potential bottlenecks before they escalate. It enables Agile teams to take proactive measures, ensuring balanced workloads and risks are mitigated early. Teams foster a culture of continuous learning and improvement by continuously analyzing performance metrics and adjusting strategies based on real-time insights. The result is a more adaptive, efficient, and high-performing Agile team that consistently delivers value and meets project goals.
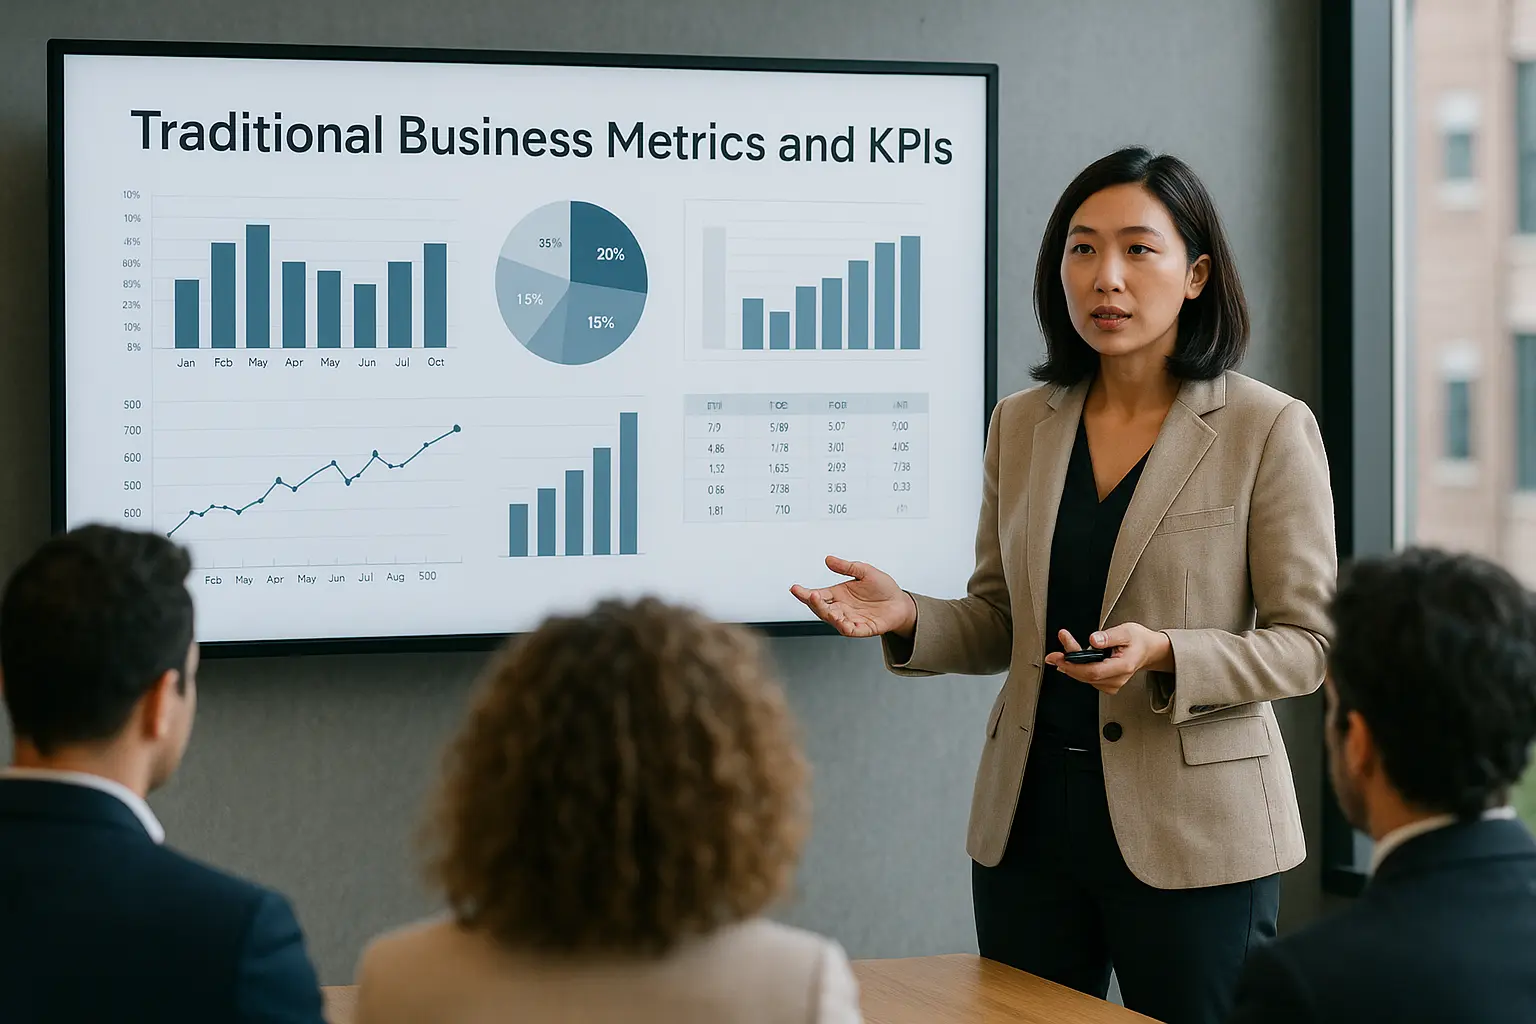
Traditional Metrics and Key Performance Indicators Reporting Considerations
Foundational Agile metrics play a role. When consistently applied, tools such as velocity tracking, cycle time, and burndown charts provide teams with reliable insight into delivery cadence and throughput. They serve as reference points and benchmarks that guide daily operations.
However, these metrics tend to be descriptive rather than diagnostic. It rarely accounts for the complexity of external influences such as market behavior, seasonal patterns, or team dynamics. Periods of trends where data stagnate or move sideways can further complicate prediction and decision-making. They also rely heavily on manual updates, which increases the risk of oversight or delay in surfacing actionable trends. Tracking scope changes and understanding their impact on project progress is also crucial, as adjustments in project scope can significantly affect overall outcomes.
When used alone, traditional reporting can become saturated with past data and disconnected from current business signals. An appropriate period for analysis is required to identify meaningful trends and patterns, as the chosen duration can reveal seasonality, political impacts, or other external influences. Selecting the correct analysis method is a significant step for analyzing data patterns over time and informing business decisions. By integrating AI, teams can preserve the clarity of their core metrics while enhancing them with forward-looking insights and scenario modeling.

Taking it to the Next Level: Beyond Measurements – Context, Trend Analysis, and Analytics
The future of Agile metrics lies in contextual understanding, not just output measurement. AI enables teams to explore why metrics trend the way they do and how those movements correlate with broader forces, whether market dynamics, team morale, or economic indicators.
For instance, connecting story-level data to sales performance or aligning sprint cadence with financial forecasting creates a richer feedback loop between delivery and strategic planning. Financial analysts and professionals use these insights to inform investment decisions and manage risk, leveraging predictive analytics to build robust portfolios. Technical analysis is key in evaluating stock movements and forecasting price direction, supporting more informed investment strategies. Teams can use these insights to adjust priorities, rebalance workloads, and identify pricing strategies or product shifts earlier. Understanding stock movements and price direction can also inform strategic planning, enabling organizations to anticipate and respond to market changes.
AI-augmented Agile metrics can help teams recognize early signals of a bear market, bull market, or upward trend, enabling them to adjust their strategies proactively in response to changing market conditions.
Getting there requires teams to rethink what data is worth capturing and how to make it visible across disciplines. With AI, Agile reporting becomes less about documenting what happened and more about preparing for what’s likely to occur and why.

Market Analysis and Trends
Staying competitive in any business environment requires understanding market analysis and trend analysis. Organizations can identify patterns that signal future trends and market shifts by analyzing historical data and monitoring market trends. Predictive analytics enables companies to forecast market behavior, anticipate market shifts, and make informed decisions that drive business strategy.
Through trend analysis, businesses can pinpoint key factors influencing market dynamics, such as customer behavior, pricing strategies, and resource allocation. This data-driven approach allows organizations to optimize their operations, identify new opportunities, and respond swiftly to changes in the market. By leveraging predictive analytics to analyze internal and external data sources, companies can stay ahead of competitors, adapt to evolving customer needs, and ensure sustained growth.
Best Practices for AI-Augmented Agile Metrics
To maximize the benefits of AI-augmented Agile metrics, teams should follow a set of best practices that ensure accuracy, relevance, and actionable insights. Start using high-quality data; clean, comprehensive, and up-to-date information is essential for reliable predictive analytics and forecasting future outcomes. Select the right metrics aligning with your team’s goals and project requirements, focusing on those reflecting progress and performance.
Continuously monitor and adjust your metrics, using predictive analytics to identify potential risks and take proactive measures before issues arise. Data visualization tools can help Agile teams track progress, spot trends, and make informed decisions quickly. Regularly review and refine your approach based on feedback and evolving project needs. By embedding these best practices into your workflow, Agile teams can harness the full power of AI-augmented metrics to deliver projects more efficiently and confidently meet customer expectations.

Common Challenges in AI-Augmented Agile Metrics
While AI-augmented Agile metrics offer significant advantages, Agile teams may encounter several common challenges during implementation. Ensuring the accuracy and relevance of the data used to train AI models is critical; poor data quality can lead to misleading insights and suboptimal decisions. Teams should also be cautious not to over-rely on automation; AI-augmented metrics are most effective when used to support, not replace, human judgment and expertise.
Interpreting the results of AI-driven analyses can be complex, and there is a risk of misinterpretation if teams lack the necessary data literacy. Additionally, AI models can inadvertently introduce bias, which may skew results and impact decision-making. Agile teams must remain vigilant, regularly reviewing and validating outputs and taking steps to mitigate potential biases. By acknowledging and addressing these challenges, teams can ensure that AI-augmented Agile metrics truly enhance their performance and support better project outcomes.

Wrapping Up: It’s Time
Agile reporting is evolving. Traditional metrics remain useful, but their value multiplies when paired with intelligent analysis in doing business research,
Whether your goal is to identify and monitor risks earlier, improve planning accuracy, or align better with organizational goals, AI offers a practical and scalable path forward. Start with the tools you already trust. Extend their reach with AI into a system that supports delivery and direction.
References:
Atlassian. (2025). Agile metrics: The 12 that actually matter. Retrieved from https://www.atlassian.com/agile/project-management/metrics
Cprime. (2025). AI in Agile: How artificial intelligence is transforming agile
Scrum.org. (2025). The Scrum guide: The definitive guide to Scrum. Retrieved from https://scrumguides.org
Keywords: Trend analysis benefits, financial markets, Google Trends, horizontal trend, financial professionals, fraud detection, time period